This blog provides some insights into the three different aspects of your data. The emailed report itself and the two further areas you can investigate through links from that report.
The Emailed GSC Report
Google Search Console Online
GSC Insights Button
You will need a Google account to benefit fully. This will allow you to click on the links in the GSC email report and open Google Search Console online. This blog covers both the emailed report and GSC online as well as the report attached to the Google Search Console Insights button.
Understanding Your Google Search Console Emailed Report
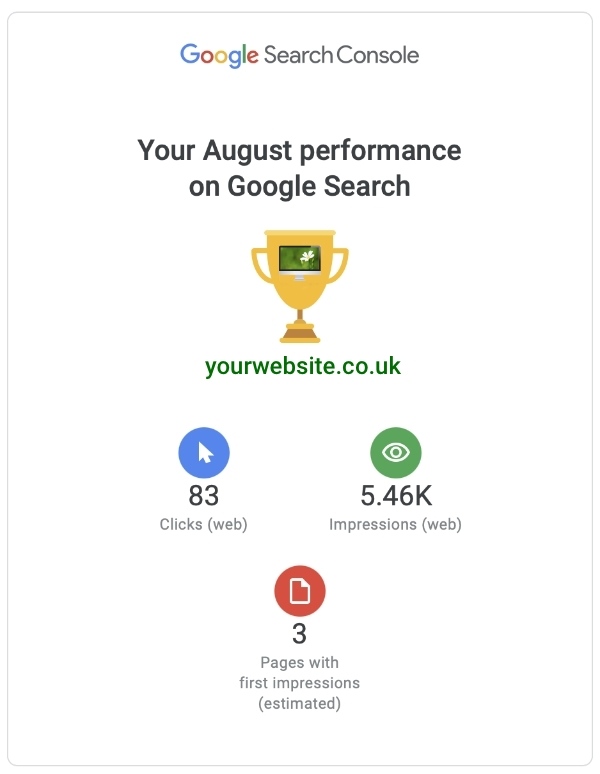
Section 1 – Your [Month] Performance on Google Search
- Clicks – This shows you how many clicks you’ve had from Google search to your website
- Impressions – This is how many times your website was included in Google’s results for a search term. Your page has appeared on a visible page but has not necessarily been seen. For example, if you appear at position 10 (bottom of page one) this will be counted as an impression even if the user didn’t scroll past position six
- Pages with First Impressions – This tells you how many pages on your website have appeared in Google Search for the first time in the previous month
Section 2 – Your Content Achievements
- Top Growing Pages – Which of your pages have seen the largest increase in clicks compared to the previous month
- Top Performing Pages – Which of your pages received the most clicks from Google Search in the month
Section 3 – How Do People Find You?
- Top Growing Queries – A query is the term a searcher types into Google which brings them to your website. Your top growing queries are those which are most improved on the previous month
- Top Performing Queries – These are the queries which generate most clicks to your website. You’ll often find that these are brand related, e.g. the name of your business or the service you offer
Section 4 – Learn About Your Audience
- Devices – Shows you how many of your organic visitors came to your site using a desktop computer (includes laptop), a tablet, or a mobile phone
- Top Countries – Shows the top three countries where your visitors come from
- Google Search Type – Which type of Google Search bought most visitors to your site. This will almost always have ‘Web’ in first position
To delve deeper click on the Performance Report button – use a desktop/laptop machine to view this information
Understanding Google Search Console Online
Google Search Console (GSC) is where you can get more detailed data about how visitors from Google find your website.
In this simple guide, you’ll learn how to use filters to discover the search terms used to find your website, or any page on it, and how your website ranks for its search terms.
Everything we need to do is included in the Performance tab on the left-hand menu, so click that button now.
Overview
The right side of the page is split into three sections. The top bar is the filters section, this is where we tell GSC what we are looking for.
Beneath that is the chart area. This displays up to four lines of data, covering:
- Clicks
- Impressions
- Average CTR (this is click-through rate, which measures clicks as a percentage of impressions. 100 impressions and 10 clicks is a 10% CTR)
- Average Position (in Google’s Search Results)
You toggle these lines on or off by clicking in the relevant box immediately above the chart.
Along the bottom of the chart is a timeline. You will learn how to adjust this shortly.
The third section on the page is the data table. This provides the detailed data which sits behind the charts. For example, it might show you the number of clicks to a page on your website or the position of certain search terms in Google’s Search Results Pages (SERPs).
Setting a Time Frame
Every query you make needs a time frame attached to it. When, for example, you look at your top keywords (search terms) you need to tell GSC whether that’s for a year, last month, or the last week.
The farthest back you can go is 16 months. You can select any period of time in the last 16 months and you can compare any two blocks of time within the same period, e.g. last month compared to the previous month, or last month compared to the same month last year.
To set the time frame:
- Click the pencil icon in the date filter (default set to last 3 months)
- When the box opens, choose either ‘Filter’ (default) to pick one period of time, or ‘Compare’ to compare one time frame to another
- Choose a pre-set time frame or set a custom one at the bottom
- Click ‘Apply’
You will now see that the chart has changed to show the time period(s) you’ve selected. If you opted to compare two time frames, dotted lines will appear on the table. The dotted line is the older time period, the solid line is the latest time period.
Use the four square buttons above the chart to toggle lines on and off.
How to See Your Top Search Terms
One of the most common queries is to find the top search terms bringing visitors to your website.
To keep things simple, set the time frame to the past 28 days, following the instructions above. Make sure Total Clicks, Total Impressions and Average Position are clicked on (they will be given a colour when they are selected and left black and white if not).
At the bottom of the page, you will now see all the search terms that your website appeared for in the last 28 days in order of most clicks to least. You can change the order of the table by clicking a table heading. Click ‘Top Queries’ for example, and the results are given in alphabetical order.
For each search term, you can see how many clicks and impressions it got, and what average position it appeared in.
To see more results, click the number 10 next to ‘rows per page’ and select how many results you’d like to see.
For more detail, click the top search term so that it is the only one on the chart (note that it has now appeared as a filter at the top of the page). Now click on the word ‘Pages’ at the top of the table.
GSC now shows you which page(s) that search term delivered searchers to.
When you are finished with that query, click the ‘X’ in the filter at the top of the page.
Top Search Terms Per Page
You should now see a list of your website’s pages.
Click on the top one of these, and note how it appears as a filter at the top of the page.
As before, you can now see the clicks and impressions for just this page, and its average position in Google SERPs.
This time, click back to the ‘Queries’ tab above the table.
Now what you can see is all the search terms that led visitors to land on that page in the time frame you specified.
To reset your filters, click the ‘X’ icons next to them at the top of the page.
How to See Your Top Pages
Finally, let’s look at how to see your top pages.
For the sake of practice, let’s compare page performance over the last 28 days to the 28 days before.
Click the pencil in the ‘Time’ filter at the top of the page. Click ‘Compare’, and then select ‘Compare last 28 days to previous period’, and press ‘Apply’.
To keep this demonstration clear, toggle off Impressions and Position so that only the blue lines for ‘Clicks’ are shown in the chart.
The solid blue line shows clicks for the latest 28 days and the dotted blue line shows the 28 days prior to that. You’ll be immediately able to see any stark differences from one month to the next.
In the table at the bottom of the page is a list of your website’s pages ordered by clicks in the last 28 days. Make sure you are on the PAGES tab You’ll also see a column for clicks in the previous 28 days and a column comparing the two.
Once more, you can change how many rows to see by clicking the ‘rows per page’ drop down, and you can alter the ordering of the page by clicking on any of the column headers.
And, also like before, you can click on any individual page for more detail. Let’s do that. Click on the top result.
You’ll note that the page you clicked on has appeared in the filter at the top of the screen. The data in the chart is now just for that one page.
Click on ‘Queries’ and you’ll now see all the queries that bought visitors to that page for the last 28 days and the 28 days prior to that. You can also see a ‘difference’ column so you can see in detail what changed.
To reset the filters, click the ‘X’ by the page filter and select ‘Pages’ once more to see all of your website’s pages.
Understanding Google Search Console Insights
This area of Google’s Search Console (GSC) dashboard brings together data from GSC and Google Analytics in an easy to digest format. Note that this is a beta product, which means it is not yet formally released and so is liable to changes without notice.
To access Search Console Insights (SCI), click on the ‘Overview’ tab inside GSC and then click the SCI tab near the top of the page. This will open SCI in a new tab.
The following is an explanation of its content. To get additional detail about any section, click the mortar board icon in the top right hand corner.
Section 1 – All-time Page Views
- This shows the number of page views your website has experienced since GSC tracking was set up.
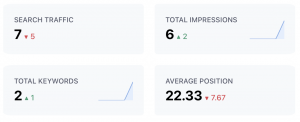
Section 2 – Site Overview
- Page Views – Number of page views in the past 28 days with a percentage change on the previous 28 days.
- Avg. Page View Duration – The average time people spent on your pages in the last 28 days. A comparison to the previous 28 days is given as a percentage.
Section 3 – Your New Content
- This shows any new pages which have been published on your website and added to Google’s index in the previous 28 days
- Click on any piece of content to get more detailed statistics just for that page.
- To get back to the first page, click the ‘site overview’ button in the top left hand corner of the screen.
Section 4 – Your Most Popular Content
- This shows the most popular pages on your website in the previous 28 days, which is measured by the number of page views
- Click on any piece of content to get more detailed statistics just for that page, including where traffic is coming from, the main search terms used to get to that page, and any links to that page from other websites or social media which are bringing visits.
- To get back to the first page, click the ‘site overview’ button in the top left hand corner of the screen.
Section 5 – How People Find You
- This breaks down the channels used by visitors to find your site.
- Direct traffic is usually from people who have bookmarked your site or are following a link in an email directly to the site
- Other traffic is a bit of a ‘catch all’ but likely includes any traffic form Google My Business amongst others.
- Referral traffic is that which comes from a link found on another site or on a blog or forum.
- Details include the proportion of all visits which come from that channel, the number of page views coming from that channel, and the average time on page of visitors from that channel.
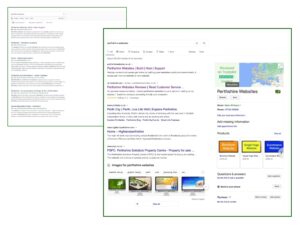
Section 6 – Google Search
- This shows how visitors to your site find it in Google, i.e. the queries that are typed into Google most frequently to find your website.
- The top line shows total page views on your site, average page view duration, and the number of clicks from Google to your site.
- Each query shows its average position in Google’s results pages and how many clicks it got in the previous 28 days. They are ranked from most clicks to least.
- Use the drop-down box above the queries list to swap from most popular to most trending queries. This prioritises search terms based on the growth of clicks in the last 28 days compared to the previous 28 days.
- View more search terms by clicking the arrow at the bottom of the section which says ‘1-5 of [50]’
Section 7 – Referring Links from Other Websites
- This section shows which external links, i.e. links from other websites, brought the most page views to your website.
- These are listed in order of most page views to fewest. Click on the blue links to visit the homepage of the linking website which opens in a new tab. This is not necessarily the page containing the link to your site.
- The top data show total number of page views and average page duration from external links as well as a percentage comparison to the previous 28 days
- Toggle between top links and newest links using the drop down box above the list of results.
- View more search terms by clicking the arrow at the bottom of the section which says ‘1-5 of [50]’
Section 8 – Social Media
- This final section shows details for traffic to your site from social media such as Facebook and YouTube.
- These are listed in order of most page views to fewest.
- The top data show total number of page views and average page duration from external links as well as a percentage comparison to the previous 28 days
- Each individual channel (e.g. Facebook) also has data for page views and average time on page.
- View more search terms by clicking the arrow at the bottom of the section which says ‘1-5 of [50]’